This is an end of term project of CS319 at the University of Wisconsin – Madison. I chose this project because I love traveling, but I’ve noticed that flight ticket prices can fluctuate quite a bit. This sparked my interest in understanding these fluctuations, and I want to dig deeper into analyzing fare trends and identifying the factors that influence ticket prices.
Objectives
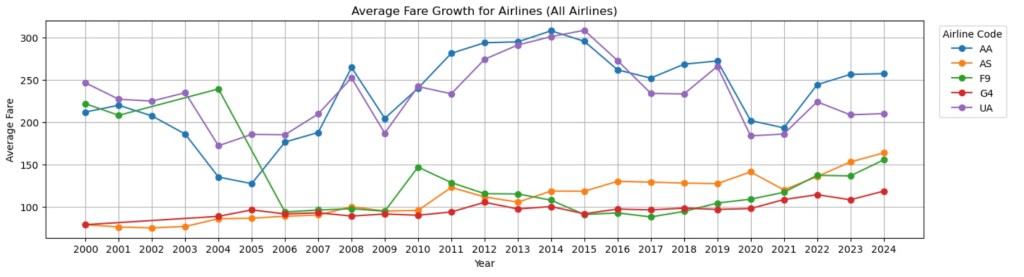
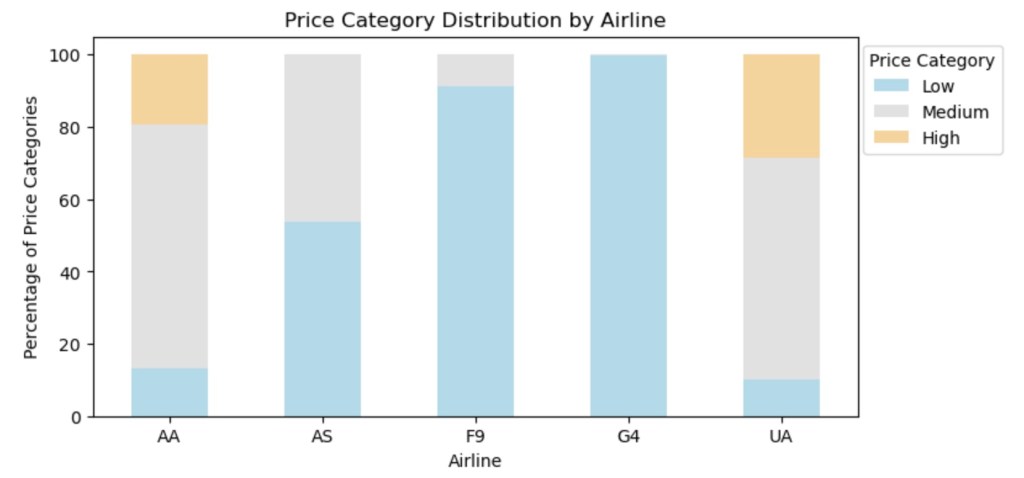
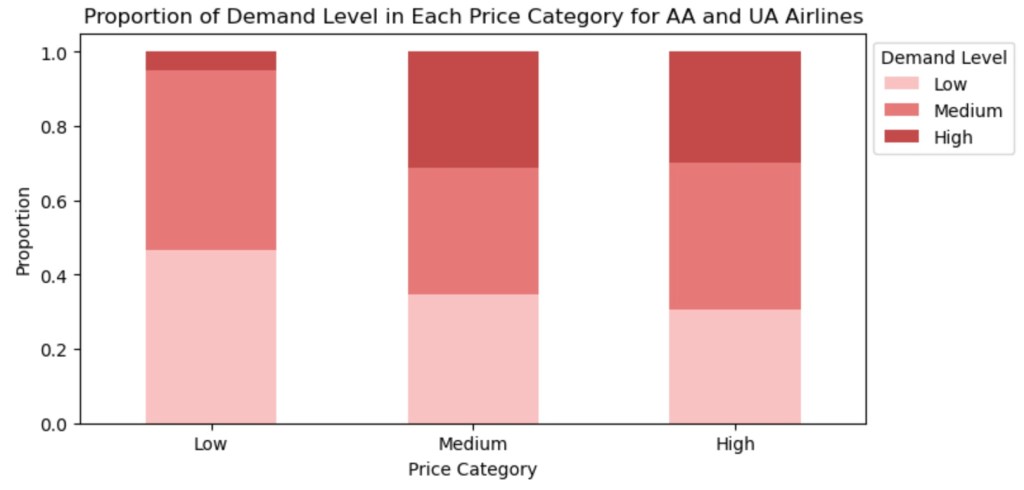
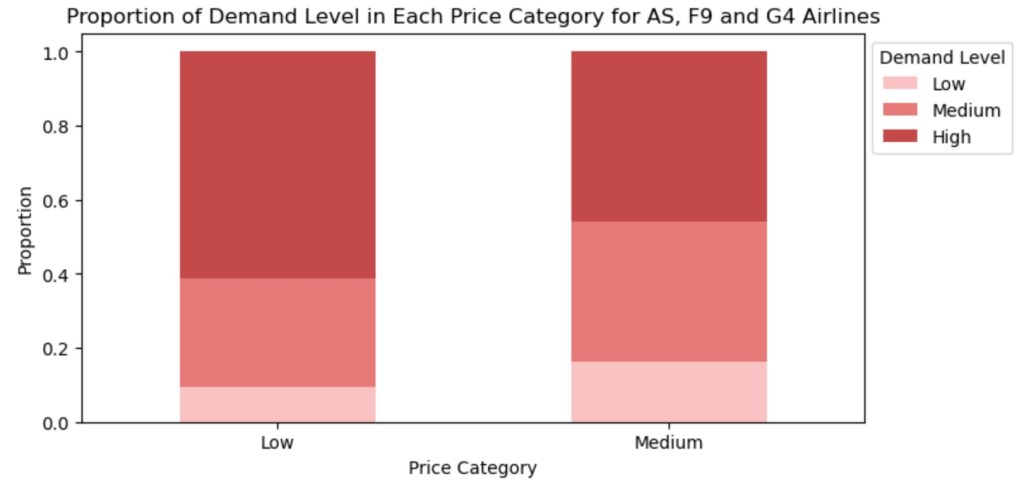
- Airline Fare Adjustments: Examining how airlines like UA and AA (high-priced) and G4, F9 (low-priced) adjust fares based on demand and the pandemic.
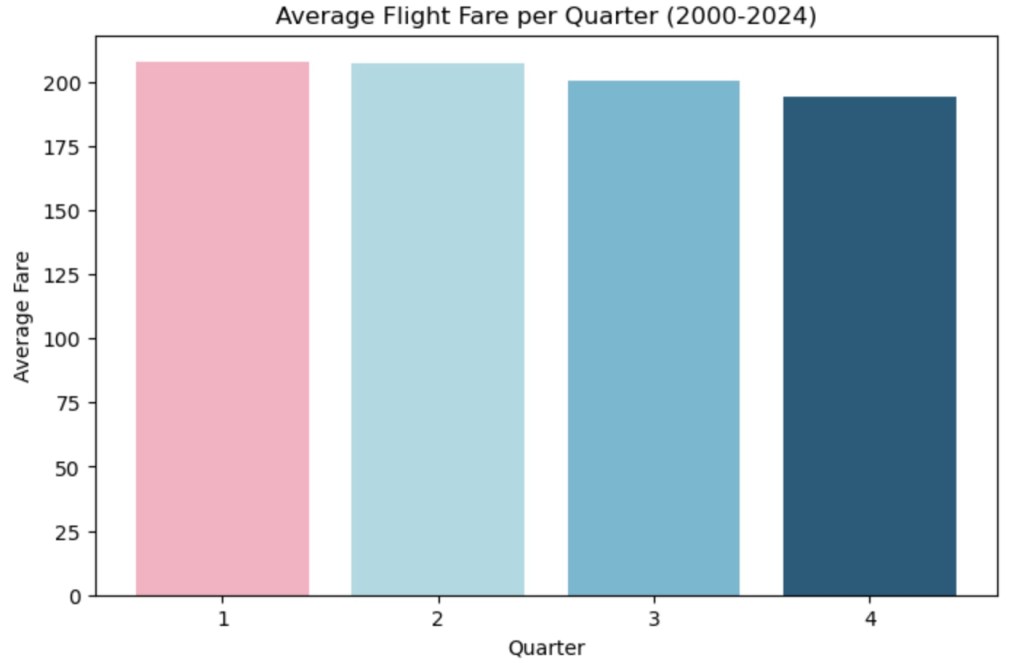
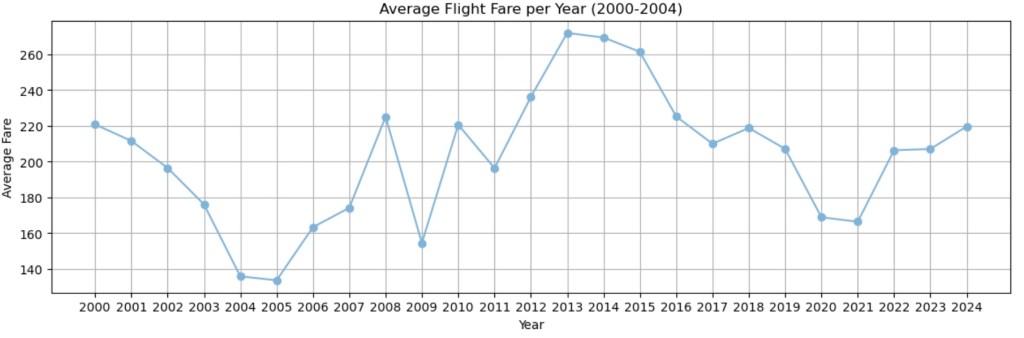
- Fare Trends: Analyzing fare reductions in 2020-2021, post-pandemic changes, and seasonal fare variations to predict future trends.
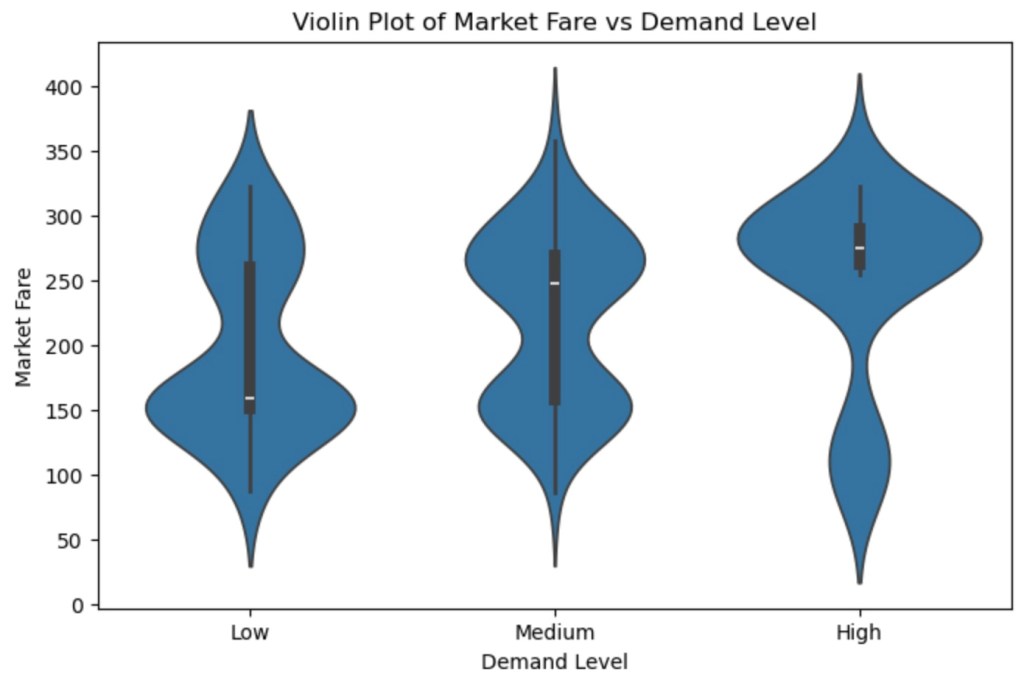
- Factors Affecting Fares: Identifying the impact of seasons, market demand, and unexpected events like the pandemic on prices.
- Consumer Insights: Helping regular flyers identify the best times to buy tickets and select airlines effectively.
Project Process
- Project Planning and Objective Definition
- Fetching the Data
- Data Collection and Preprocessing
- Exploratory Data Analysis (EDA)
- Data Visualization
- Summary
Data Overview
| Column Name | Description |
|---|---|
Year | Year |
quarter | Quarter |
mkt_fare | The average fare for the route for the airline |
city1 | The name and state of the first city |
city2 | The name and state of the second city |
carairlineid | The airline ID identifying the airline operating the flight |
car | The airline code identifying the airline |
carpax | The number of passengers carried by the airline on the route |
carpaxshare | The market share of the airline on a specific route |
caravgfare | Carrier’s average fare for the route |
fareinc_min | The smallest fare change |
fareinc_minpaxsh | The share of passengers paying the minimum fare increase |
fareinc_max | The largest fare change |
fareinc_maxpaxsh | The share of passengers paying the maximum fare increase |
fare_inc_x3paxsh | The percentage of passengers paying three times minimum fare |
price_category | Derived Column, Fare category (e.g., Low, Medium, High fare levels) |
demand_level | Derived Column, Demand level for the flight (e.g., High, Medium, Low demand) |
Date Visualization