This is a group project for the end of term in LIS 705 at the University of Wisconsin-Madison. The task is to analyze data science salaries. The dataset includes several key pieces of information such as job title, experience level, remote work ratio, and more. We chose this dataset to explore salary trends, the impact of remote work, and salary differences across countries. As future data analysts, understanding these patterns will help us prepare for the job market and make better career decisions.
Data Overview
| Column Name | Description |
|---|---|
| work_year | Represents the year of employment. |
| experience_level | Represents the level of work experience. |
| job_title | The title of the job. |
| salary_in_usd | Salary in USD. |
| remote_ratio | The ratio of remote work. |
| company_location | The location of the company. |
| company_size | The size of the company. |
| employee_residence | The residence of the employee. |
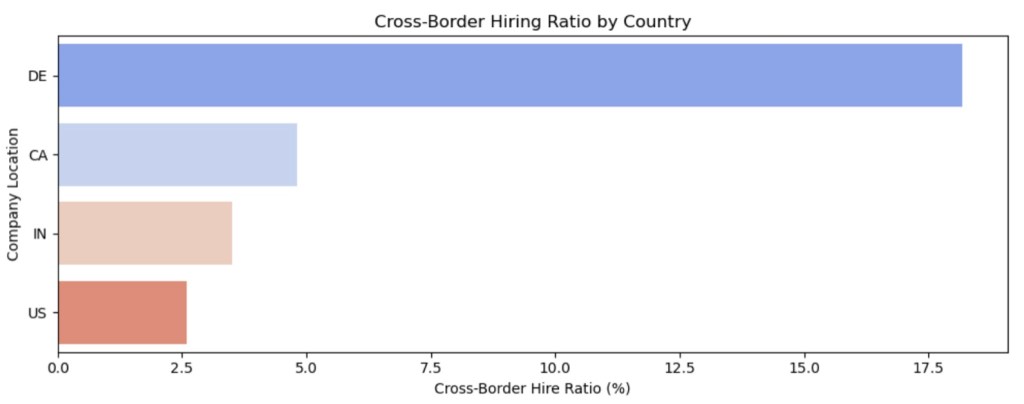
| is_cross_country | Indicates if the employee works cross-country, determined by comparing employee_residence and company_location (i.e., df_cleaned['employee_residence'] != df_cleaned['company_location']). |
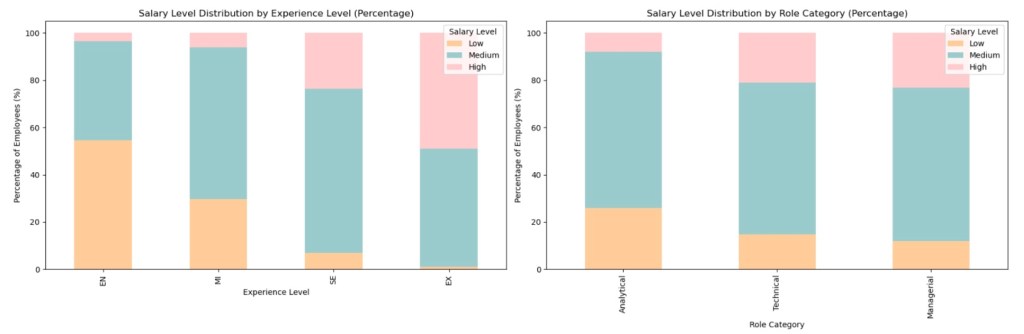
| salary_level | Derived data, indicating the salary level (Low, Medium, and High). |
| role_category | Derived data, categorizing the role (Managerial, Technical, and Analytical). |
| avg_salary_per_role_and_company_size | Summary data representing the average salary for each “role_category × company_size” combination. |
Data Visualization